Study notes
Visual Studio - Jupyter notebook
Syntax:
numpy.histogram(a, bins=10, range=None, density=None, weights=None)
- numpy.histogram
- matplotlib.pyplot.hist
- matplotlib.pyplot.show()
The number of observations of each class interval of a variable. Class intervals are ordered groupings of a variable’s values.
# Grouped Frequency Distribution
import numpy as np
import matplotlib.pyplot as plt
x = [21, 2, 23, 4, 25, 6, 27, 81, 1, 32, 20, 4, 25, 62, 4]
# Group in 4 clases (range)
nb = 4
# compute
z= np.histogram(x,nb)
# show
plt.hist(x,nb)
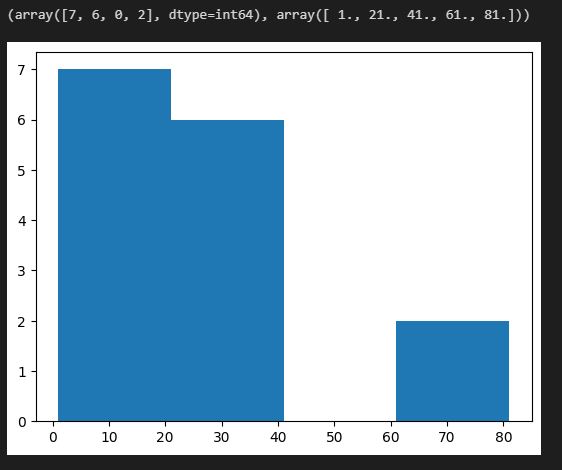
print(z)
plt.show()
# Class (range) -> Nr of elementsin class
# 0 -> 2 1(21 not included) -> 7
# 21 - 41 (41 not included) -> 6
# 41 - 61 (61 not included) -> 0
# 61 - 81 (81 included) -> 2
Result:
Main source:
numpy.histogram — NumPy v1.24 Manual