Study notes
numpy.array
create an array of items optimised for data analysis.
import numpy as np
# Data loaded into a Python list structure
data = [50,50,47,97,49,3,53,42,26,74,82,62,37]
# Data is optimised for numeric analysis
val = np.array(data)
print (type(data),'x 2:', data * 2)
print (type(val),'x 2:', grades * 2)
Result:
<class 'list'> x 2: [50, 50, 47, 97, 49, 3, 53, 42, 26, 74, 82, 62, 37, 50, 50, 47, 97, 49, 3, 53, 42, 26, 74, 82, 62, 37]
<class 'numpy.ndarray'> x 2: [100 100 94 194 98 6 106 84 52 148 164 124 74]
numpy.shape
Return shape of an array
np.shape(val)
# or
val.shape
(13,)
13 elements (one dimension aray)
numpy.mean()
Return arithmetic mean (average)
import numpy as np
data = [50,50,47,97,49,3,53,42,26,74]
val = np.array(data)
val.mean()
Result:
49.1
Display numpay array.
import numpy as np
data = [50,50,47,97,49,3,53,42,26,74,82,62,37,15,70,27,36,35,48,52,63,64]grades = np.array(data)
study_hours = [10.0,11.5,9.0,16.0,9.25,1.0,11.5,9.0,8.5,14.5,15.5,13.75,9.0,8.0,15.5,8.0,9.0,6.0,10.0,12.0,12.5,12.0]
student_data = np.array([study_hours, grades])
print(student_data)student_data
Result:
[[10. 11.5 9. 16. 9.25 1. 11.5 9. 8.5 14.5 15.5 13.75
9. 8. 15.5 8. 9. 6. 10. 12. 12.5 12. ]
[50. 50. 47. 97. 49. 3. 53. 42. 26. 74. 82. 62.
37. 15. 70. 27. 36. 35. 48. 52. 63. 64. ]]
array([[10. , 11.5 , 9. , 16. , 9.25, 1. , 11.5 , 9. , 8.5 ,
14.5 , 15.5 , 13.75, 9. , 8. , 15.5 , 8. , 9. , 6. ,
10. , 12. , 12.5 , 12. ],
[50. , 50. , 47. , 97. , 49. , 3. , 53. , 42. , 26. ,
74. , 82. , 62. , 37. , 15. , 70. , 27. , 36. , 35. ,
48. , 52. , 63. , 64. ]])
Format output of a float number
Set number of decimals to be shown after decimal point
import numpy as np
data = [50,50,47,97,49,3,53,42,26,74,82,62,37,15,70,27,36,35,48,52,63,64]grades = np.array(data)
study_hours = [10.0,11.5,9.0,16.0,9.25,1.0,11.5,9.0,8.5,14.5,15.5,13.75,9.0,8.0,15.5,8.0,9.0,6.0,10.0,12.0,12.5,12.0]
avg_study = student_data[0].mean()
avg_grade = student_data[1].mean()
# avg_study value will go into the first {:.2f} and the avg_grade value will go into the second
# {:.2f} mans value will be shown as float number with 2 fingers after decimal point and as many as necessary before decimal point.
print('Average study hours: {:.2f}Average grade: {:.2f}'.format(avg_study, avg_grade))
Result:
Average study hours: 10.52
Average grade: 49.18
Multidimensional numpy array
import numpy as np
data = [50,50,47,97,49,3,53,42,26,74,82,62,37,15,70,27,36,35,48,52,63,64]
grades = np.array(data)
study_hours = [10.0,11.5,9.0,16.0,9.25,1.0,11.5,9.0,8.5,14.5,15.5,
13.75,9.0,8.0,15.5,8.0,9.0,6.0,10.0,12.0,12.5,12.0]
name = ['Dan', 'Joann', 'Pedro', 'Rosie', 'Ethan', 'Vicky', 'Frederic', 'Jimmie',
'Rhonda', 'Giovanni', 'Francesca', 'Rajab', 'Naiyana', 'Kian', 'Jenny',
'Jakeem','Helena','Ismat','Anila','Skye','Daniel','Aisha']
student_data = np.array([name, study_hours, grades])
student_data.shape
Result:
(3,22)
3 arrays, each with 22 elements.
Panda dataframe
Numpy manages perfect unidimensional data. Pandas is used to manipulate multidimensional data. It uses dataframes.
import pandas as pd
grades = [50,50,47,97,49,3,53,42,26,74,82,62,37,15,70,27,36,35,48,52,63,64]
study_hours = [10.0,11.5,9.0,16.0,9.25,1.0,11.5,9.0,8.5,14.5,15.5,
13.75,9.0,8.0,15.5,8.0,9.0,6.0,10.0,12.0,12.5,12.0]
names = ['Dan', 'Joann', 'Pedro', 'Rosie', 'Ethan', 'Vicky', 'Frederic', 'Jimmie',
'Rhonda', 'Giovanni', 'Francesca', 'Rajab', 'Naiyana', 'Kian', 'Jenny',
'Jakeem','Helena','Ismat','Anila','Skye','Daniel','Aisha']
# create dataframe
df_students = pd.DataFrame({'Names':names,
'StudyHours':study_hours,
'Grade':grades})
# Display dataframe in tabular format
df_students
Result:
Finding data in a DataFrame
Find one record (all columns)
df_students.loc[5]
Result:
Names Vicky
StudyHours 1.0
Grade 3
Name: 5, dtype: object
Find one record, one colums
df_students.loc[0,'Names']
Result:
'Dan'
Find multiple records (all record: all columns)
# Show records from location/key 0 to 5 (inclusive)
df_students.loc[0:3]
# Show records from location/key 0 to 3 (exclude location 3)
df_students.iloc[0:3]
df_students.iloc[0:3,[1,2]]
Result:
| SudyHours | Grade | |
|---|---|---|
| 0 | 10.0 | 50 |
| 1 | 11.5 | 50 |
| 2 | 9.0 | 47 |
Filter data
df_students[df_students['Names']=='Aisha']
# or
df_students[df_students['Name's]=='Aisha']
# or
df_students[df_students.Name == 'Aisha']
# or
df_students.query('Names=="Aisha"')
Result:
| # | Names | StudyHours | Grade |
|---|---|---|---|
| 21 | Aisha | 12.0 | 64 |
Loading a DataFrame from a file
import pandas as pd
# For windows, you must have wget installed
# Not? Download it from https://www.gnu.org/software/wget/ then add location where it is wget.exe to PATH environment variable. How to? Search on the net.
!wget https://raw.githubusercontent.com/MicrosoftDocs/mslearn-introduction-to-machine-learning/main/Data/ml-basics/grades.csv
df_students = pd.read_csv('grades.csv',delimiter=',',header='infer')
# Show the firts 5 records from dataframe
df_students.head()
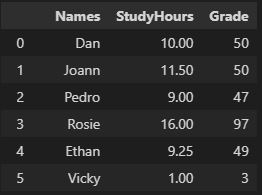
Result
| # | Name | StudyHours | Grade |
|---|---|---|---|
| 0 | Dan | 10.00 | 50.0 |
| 1 | Joann | 11.50 | 50.0 |
| 2 | Pedro | 9.00 | 47.0 |
| 3 | Rosie | 16.00 | 97.0 |
| 4 | Ethan | 9.25 | 49.0 |
Dataframe missing values.
df_students.isnull()
For every item in all records and all columns display FALSE if value is NOT NULL and TRUE is value is NULL
df_students.isnull().sum()
Show sum of NULL values per every colums
# Get all records that has NULL value on any columns.
# axis=1 means every row
df_students[df_students.isnull().any(axis=1)]
Result:
| # | Name | StudyHours | Grade |
|---|---|---|---|
| 22 | Bill | 8.0 | NaN |
| 23 | Ted | NaN | NaN |
Dealing with dataframe null values
# Replace with mean (columns values must be numeric)
df_students.StudyHours = df_students.StudyHours.fillna(df_students.StudyHours.mean())
df_students[df_students.isnull().any(axis=1)]
# | StudyHours | Grade | |
|---|---|---|---|
| 22 | Bill | 8.000000 | NaN |
| 23 | Ted | 10.413043 | NaN |
# Delete records that contains NULL values
# axis=0 means any columns
df_students = df_students.dropna(axis=0, how='any')
df_students[df_students.isnull().any(axis=1)]
Result:
Nothing shown because - not NULL values in dataframe.
Explore dataframe
# Get mean
mean_study = df_students['StudyHours'].mean()
mean_grade = df_students.Grade.mean()
# Get students who studied more than average (mean)
df_students[df_students.StudyHours > mean_study]
df_students
Result:
Name
# | StudyHours | Grade | |
|---|---|---|---|
| 1 | Joann | 11.50 | 50.0 |
| 3 | Rosie | 16.00 | 97.0 |
| 6 | Frederic | 11.50 | 53.0 |
| 9 | Giovanni | 14.50 | 74.0 |
Their mean grade
df_students[df_students.StudyHours>mean_study.Grade.mean()
66.7
#Assume pass grade is 60, shoe all students with pass TRUE or FALSE
paasses =pd.Series(df_students['Grade']>=60)
passes
passes
Result:
0 False
1 False
2 False
3 True
4 False
..
..
#Create a new column and add to dataframe ; axix=1 means add a column
paasses =pd.Series(df_students['Grade']>=60)
df_students = pd.concat([df_students, paasses.rename("Pass")], axis=1);df_students
df_students
paasses =pd.Series(df_students['Grade']>=60)
df_students = pd.concat([df_students, paasses.rename("Pass")], axis=1);df_students
df_students
Result:
Name
# | StudyHours | Grade | Pass | |
|---|---|---|---|---|
| 0 | Dan | 10.00 | 50.0 | False |
| 1 | Joann | 11.50 | 50.0 | False |
| 2 | Pedro | 9.00 | 47.0 | False |
| 3 | Rosie | 16.00 | 97.0 | True |
| 4 | Ethan | 9.25 | 49.0 | False |
# Groupby
r = df_students.groupby(df_students.Pass).Name.count()
print(r)
print(r)
Result:
Pass
False 15
True 7
Name: Name, dtype: int64
Sort and replace original dataframe with the result.
df_students = df_students.sort_values('Grade', ascending=False)
df_students
References:
Exam DP-100: Designing and Implementing a Data Science Solution on Azure - Certifications | Microsoft Learn
Welcome to Python.org
NumPy user guide — NumPy v1.24 Manual
pandas - Python Data Analysis Library (pydata.org)